Faster resolution
Causality chains, conversational AI query, and semantic deduplication collapse hours of manual cross team correlation into seconds, directly cutting mean time to resolution on multi service incidents.
Enterprise AI Platform · 25 Products
Explore productsXpediOo AIOps & AI Log Management ingests every log line and every monitoring event your enterprise produces, alerts fired by APM, network, synthetic, and ITSM tools included. It uses machine learning to deduplicate and correlate them, collapses alert storms into a handful of actionable incidents and, within approval gated guardrails, resolves recurring failures before a human ever gets paged.
Enterprise environments don't just bury teams in log lines. They bury them in alerts. A single upstream failure can trigger hundreds of near simultaneous notifications across APM tools, network monitors, synthetic checks, and ticketing systems, each one looking like its own incident. On call engineers routinely spend the most critical minutes of an outage untangling which alerts are symptoms and which one is the cause, before log analysis has even started.
XpediOo AIOps & AI Log Management solves both problems in one platform. Every log is ingested and normalized, and machine learning mines it for the handful of patterns that matter. In parallel, every event fired by connected monitoring, network, and ITSM tools is deduplicated, grouped by topology, and correlated in real time. This is the AIOps core, purpose built to turn a flood of alerts into a small number of actionable incidents. Both streams feed the same root cause engine, so the platform explains a single incident with the full picture: the alerts that fired, how they relate, and the log lines that explain why. Predictive models and approval gated automation stand ready to resolve the recurring ones on their own.
A single ingestion layer that speaks every log format your estate produces, normalized into one queryable schema before it reaches search or AI analysis.
Every alert your monitoring and ITSM stack produces (metrics, APM, network, synthetic checks, and tickets) lands in the same event stream as your logs, ready for AI correlation.
Machine learning clusters millions of log lines into a handful of recurring patterns, then flags the ones that deviate from the historical baseline.
The core of AIOps: collapsing a flood of alerts from a dozen disconnected monitoring tools into a small number of deduplicated, topology aware, prioritized incidents.
Correlates anomalous log patterns and deduplicated events across services, hosts, and time windows into a single causal narrative, not a wall of unrelated alerts.
Moves from explaining what already happened to forecasting what is about to happen and, within approved guardrails, fixing it automatically.
Enterprise grade controls for how long logs and events live, who can see them, and how the platform holds up under audit.
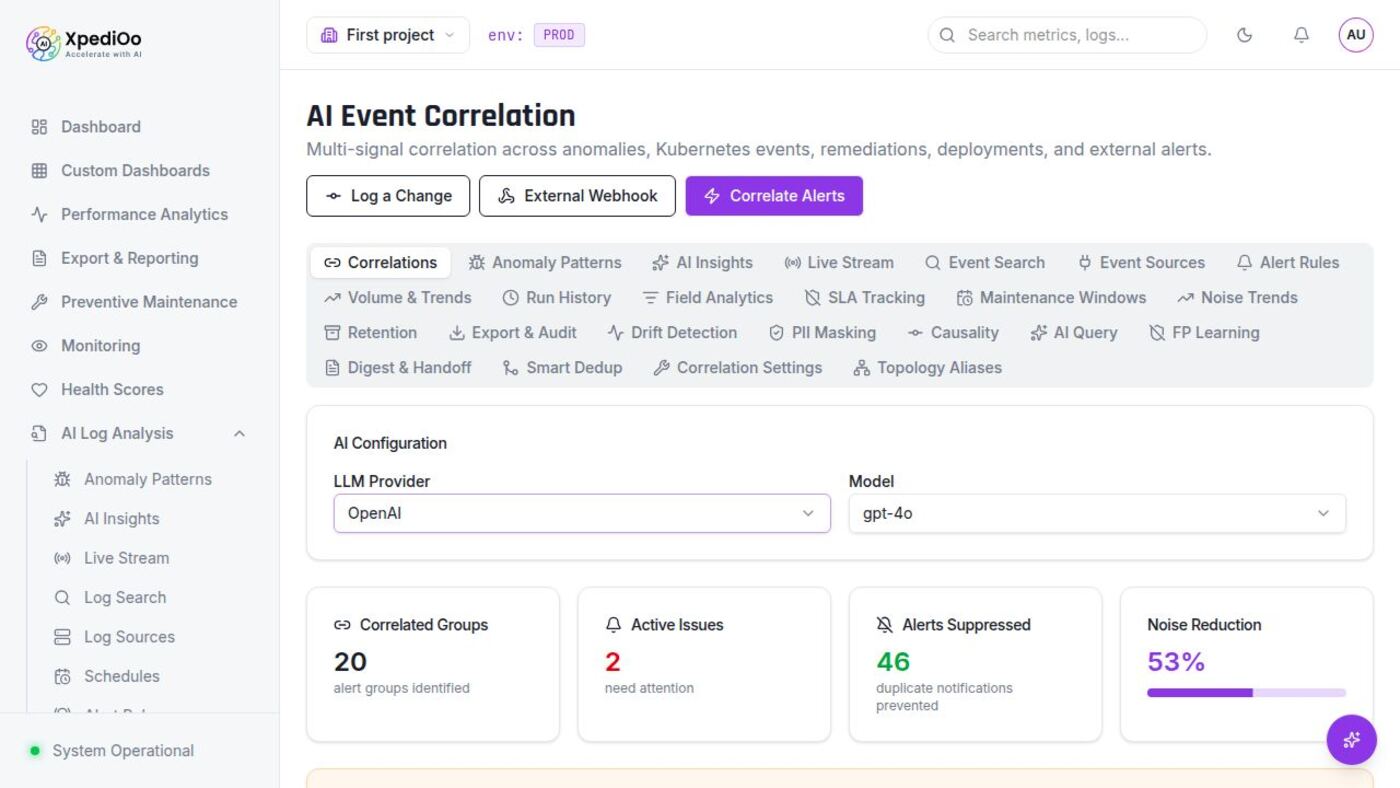
AI Log Analysis and AI Event Correlation are XpediOo's two AI native surfaces. One reasons over raw log text, the other over the signals every other part of the platform produces. Together they form this platform's AIOps layer: the part of the system that doesn't just show data, but explains it, groups it, predicts it, and tells operators what to do next. Below is every high and medium impact capability on both surfaces (44 in total), each with a live product screenshot, what it does, and the business outcome it drives.
Causality chains, conversational AI query, and semantic deduplication collapse hours of manual cross team correlation into seconds, directly cutting mean time to resolution on multi service incidents.
False positive learning, alert noise correlation, and drift detection mean the system gets quieter and more accurate over time instead of paging the same person for the same nonissue every week.
PII masking, retention policies, SLA tracking, and compliance export are built into both engines natively, not bolted on, so security and compliance reviews are a formality rather than a project.
The default, foundational view of AI Log Analysis: AI detected anomaly patterns across every ingested log source, with severity, trend, and confidence for each one. Every high and medium impact Log Analysis capability in this document builds on the anomaly stream produced here.
The default, foundational view of Event Correlation: multi signal grouping across anomalies, Kubernetes events, remediations, deployments, and external alerts into a single correlated incident view. Every high and medium impact AIOps capability in this document builds on the correlation groups produced here.
10 high impact capabilities, 11 medium impact capabilities
Uses AI to trace how a failure in one service propagates into failures in dependent services, reconstructing the full chain from root cause to symptoms.
Collapses hours of manual cross team log correlation into an automatically generated causal chain, dramatically shortening root cause analysis during multi service incidents.
A conversational interface for querying log data in plain English, with the AI translating questions into the underlying filters and returning direct answers grounded in the matching log entries.
Makes log data accessible to engineers who aren't fluent in query syntax and speeds up ad hoc investigation for everyone else.
Learns from dismissal feedback which alert patterns are consistently false positives and automatically suppresses future recurrences of them.
Directly reduces alert fatigue (the single biggest driver of ignored or delayed responses to real incidents) by keeping the noise to signal ratio in check over time.
Uses semantic similarity, not just exact string matching, to cluster anomalies that are really the same underlying root cause reported multiple times, surfacing one canonical entry per cluster.
Cuts through duplicate noise in incident lists and reporting, so headline metrics reflect the true number of distinct problems rather than an inflated raw event count.
Generates an automatic AI written summary of anomalies, resolutions, and outstanding risks over a chosen period: an 8 hour shift, a day, or a week.
Standardizes shift handoffs and management reporting, ensuring nothing falls through the cracks when responsibility changes hands, and gives leadership a digestible operational pulse.
AI analyzes the historical cadence of recurring issues and predicts when the same pattern is statistically likely to reoccur, with a confidence score and a 24 hour forecast window.
Shifts operations from purely reactive firefighting to proactive prevention, letting teams schedule fixes or capacity changes ahead of a predicted recurrence.
Establishes a statistical baseline of normal log behavior per source and continuously checks for gradual deviation in error rate, warning rate, or volume.
Catches slow building degradations (a memory leak, a creeping error rate) that single anomaly detection would miss because no individual event looks alarming on its own.
Groups alert firings that stem from the same underlying incident into a single correlated notification instead of firing one alert per rule per event.
Prevents an on call engineer's phone from lighting up with twenty pages for one incident, reducing response fatigue and making the true blast radius obvious immediately.
Tracks the time from anomaly detection to resolution against configured response time targets per severity, flagging breaches as they approach or occur.
Gives engineering leadership objective, real time visibility into whether operational commitments, internal or contractual, are being met before a customer has to ask.
Automatically detects and masks sensitive personal data (emails, card numbers, SSNs, tokens) in log content before it is stored, displayed, or sent to an LLM.
Reduces regulatory exposure (GDPR, PCI DSS, HIPAA) by ensuring sensitive data never lands unmasked in a system engineers routinely have broad access to.
Every detected anomaly gets an AI writeup explaining what happened, why it's risky, and what's likely to break next, with no need to parse raw stack traces or correlate logs by hand.
On call engineers and less technical stakeholders (support, leadership) reach a shared understanding of incident severity in seconds, speeding up triage and cross team communication.
A live, continuously updating feed of log entries as they are emitted by your infrastructure, filterable by source and severity level in real time.
Teams can watch a deployment or incident fix take effect live instead of waiting on periodic refreshes, shortening validation time after a change.
Full text and structured search across the entire retained log history, with filters for time range, source, severity, and tags, plus an AI assisted search mode.
Root cause investigations that used to mean grepping through server files now take seconds, materially reducing incident resolution time and audit turnaround.
A managed inventory of every system, service, and environment feeding logs into the platform, with health status for each connection.
Gaps in log coverage (a silent agent, a misconfigured shipper) are visible immediately, preventing blind spots that would otherwise hide real incidents.
Configures anomaly scans to run automatically on a recurring cadence (hourly, daily, or custom) instead of requiring someone to trigger them manually.
Detection coverage no longer depends on an engineer remembering to run a scan, which is critical for 24/7 operations and off hours incident coverage.
Defines precise trigger conditions (thresholds, patterns, or combinations) that fire an alert the moment matching log activity occurs.
Turns passive log storage into an active early warning system, so responders are notified proactively instead of discovering problems reactively.
Time series visualization of log throughput and severity mix across sources, surfacing volume spikes, dropoffs, and long term trend shifts.
Capacity planning and anomaly detection both benefit: sudden volume changes are often the first visible sign of an outage, security event, or silent failure.
A full audit trail of every anomaly detection run (when it executed, what configuration was used, and what it found) with run to run comparison.
Gives compliance and engineering leadership a verifiable record that monitoring is actually happening consistently, and lets teams compare results run over run.
Extracts structured fields (IP addresses, endpoints, response times, user IDs) out of unstructured log text using built in or AI suggested patterns, then aggregates them like a spreadsheet.
Turns free text logs into queryable business and operational metrics, e.g. "top IPs causing 500 errors", without needing a data engineering project.
Defines automated policies for how long log data of each type or source is retained before deletion, enforced without manual cleanup.
Balances storage cost against compliance requirements (e.g. HIPAA, SOC 2 retention windows) automatically, removing a common source of audit findings and storage overruns.
Exports raw or filtered logs for external analysis, and reviews a compliance audit log of every retention and export action taken on the data.
Satisfies auditor and regulator requests for evidence of data handling controls, and supports eDiscovery or forensic investigations without engineering involvement.
10 high impact capabilities, 13 medium impact capabilities
Signals from anomalies, Kubernetes events, remediations, deployments, and external alerts within a 30 minute window across two or more resources are sent to the LLM for causal analysis, which identifies the root cause, how it propagated, and the downstream symptoms.
Collapses hours of manual, cross team correlation work into an automatically generated causal chain. Chains below 60% confidence are discarded, and repeat triggers are suppressed for an hour to avoid noise.
A conversational interface for asking plain English questions about correlated events, grounded in the full real time signal feed plus every AI correlated group.
Gives on call engineers immediate answers to the questions that come up in almost every incident review, such as "why did payment-service start alerting?", with no query to write.
Every dismissal of a correlated group is a signal. Root cause patterns dismissed five or more times with a high false positive rate are automatically suppressed, so future groups are created as "Suppressed" instead of noisy "Active" alerts.
Keeps the correlation engine self tuning: the patterns that page on call for nothing get quieter over time without anyone editing a rule.
Clusters alert correlation groups by semantic similarity of their root cause, turning "DB latency spike on db-server-01" and "db-server-01 experiencing high query latency" from different analysis runs into one canonical recurring root cause with a merged signal count.
Headline noise reduction metrics reflect the true number of distinct operational problems, not an inflated count of redetected duplicates across runs.
Generates a plain English operational briefing covering stability, correlated group trends, resource health, and recommended actions, ready for shift handoffs, executive reviews, or SOC 2 operational audits.
Gives incoming shifts and leadership a consistent, digestible operational summary without anyone having to manually assemble one from raw alert history.
Tunable composite scoring across three strategies (Topology for the service dependency graph, Timing for the coincidence window, and Wording for message similarity) that determines how aggressively signals are grouped together.
Lets operators tune correlation behavior to their environment: raise Topology weight where the dependency map is well maintained, or raise Wording weight in noisy, repetitive alert environments.
Continuously learns normal signal behavior per source type per hour of day and alerts when volume or critical signal rate deviates significantly from that learned baseline.
Surfaces slow building shifts in alert behavior (a source quietly getting noisier or a critical rate creep) that a single correlation run would never flag on its own.
Applies the same shared masking rule set used by Log Analysis to every signal message before it reaches the correlation AI, with a live tester for event style content.
Guarantees consistent data handling policy across both AIOps surfaces: one set of redaction rules, enforced everywhere signals reach an LLM, with no separate configuration to maintain.
Tracks acknowledgement and resolution windows for correlated event groups by severity, with an automatic breach checker and escalation tracking.
Gives leadership the same objective, real time SLA visibility for cross system incidents that Log Analysis provides for individual anomalies.
A live registry of every signal type feeding the correlation engine (anomalies, Kubernetes events, remediation actions, change and deployment events, and external webhook or polled integrations), each with a 7 day event count and health indicator.
Gives operators one place to confirm every upstream signal pipeline is actually delivering before they trust the correlation results built on top of it.
Surfaces recurring signal shapes across the last 7 days (the same Kubernetes warning, anomaly type, or change repeatedly hitting the same resource), not just a single run's grouping.
Highlights the chronic, slow burning issues that a one off correlation run would miss because no individual occurrence looks urgent.
An AI generated pattern intelligence summary drawn from recurring signal patterns across every correlation source, each with a severity tag and a plain English explanation.
Gives responders a fast, prioritized reading list of what actually matters across the noise, without opening every individual correlation group.
A live, continuously updating feed of every signal type (anomalies, Kubernetes events, remediations, changes, external alerts, app server alerts), filterable by source as they occur.
Lets an operator watch a live incident or a change rollout unfold signal by signal in real time, across every source type at once.
Full text and structured search across every correlated signal, with filters for source type and severity and a breakdown of matches by category.
Turns ad hoc "what happened with this resource last week" questions into a search of a few seconds instead of a manual sweep across multiple source pages.
Rules evaluated against correlated event groups every time analysis runs, matching on correlation type, severity, resource, or signal source rather than raw log text.
Lets teams route notifications for specific correlation shapes (e.g. any critical severity group touching payment-api) without waiting on a human to notice it.
Real event throughput over time across all signal sources, with hourly bucketing and breakdowns by severity.
Gives capacity and on call planning teams the same trend visibility over correlated events that Log Analysis provides over raw log volume.
Every "Correlate Alerts" analysis run over the last 30 days, with signal counts, new groups, flapping, suppression, and noise reduction percentage, plus the ability to diff two runs.
Gives engineering leadership a verifiable, comparable record that correlation is running consistently and actually reducing noise run over run.
Ready made, one click analyses over real correlated signals: noisiest resources, critical only hotspots, top signal source types, most frequent event types, Kubernetes warning hotspots, and external alert hotspots.
Gives on call engineers immediate answers to the questions that come up in almost every incident review, with no query to write.
Signals whose resource and severity fall inside an active, scheduled maintenance window are suppressed before correlation runs.
Known safe changes (a scheduled database maintenance, a planned patch window) don't spam the team with new alert groups.
Tracks noise reduction percentage and mean time to acknowledge/resolve (MTTA/MTTR) for correlated groups over time, across every historical "Correlate Alerts" run rather than just the latest snapshot.
Lets leadership see whether the correlation engine's effectiveness is actually improving over time, not just what it looks like today.
Automated purge policies for correlated event groups past a configured compliance retention window, with a full retention audit trail.
Extends the same storage cost and compliance balancing that Log Analysis retention provides to the correlation domain's own data.
Exports filtered correlated event groups as CSV, JSON, or a formatted PDF report, and maintains a compliance audit trail of every correlation run and export with PII masking counts.
Gives auditors and compliance teams the same SOC 2 and GDPR ready evidence trail for cross system incident correlation that exists for raw log handling.
Maps a signal's resource identifier to its dependency map application name when automatic name normalization isn't enough: for example, a Kubernetes pod name versus a dependency map service name that differ structurally.
Keeps topology weighted correlation accurate even when naming conventions differ across the systems feeding signals into the engine, instead of silently under correlating them.
Most "AIOps" claims amount to a single anomaly detection model bolted onto a dashboard. XpediOo's AI Log Analysis and AI Event Correlation go considerably further: causal reasoning across services, conversational access to both raw logs and correlated incidents, self tuning false positive suppression, semantic deduplication, drift detection against learned baselines, and compliance grade retention, export, and PII handling. All of it is built natively into two pages that already share a detection and correlation core.
Fewer pages for the same incident, faster root cause attribution, and a conversational way to ask questions instead of writing queries.
Objective SLA visibility, run history you can audit, and a system that gets measurably quieter over time instead of noisier.
PII masking and retention are enforced by default across both engines, with an audit trail ready for SOC 2, GDPR, or HIPAA review on request.
| Domain | Coverage |
|---|---|
| Infrastructure and OS | Syslog, journald, Windows Event Log, and SNMP traps |
| Cloud native logs | AWS CloudWatch Logs, Azure Monitor Logs, and GCP Cloud Logging |
| Containers and orchestration | Kubernetes pod, node, and control plane logs via DaemonSet collectors |
| Application frameworks | Log4j/Logback, Python logging, .NET diagnostics, Node.js, and Go structured logging |
| Web and network | NGINX, Apache, HAProxy, load balancer, and firewall logs |
| Databases | PostgreSQL, MySQL, MS SQL, Oracle, and MongoDB slow query and error logs |
| Security | IDS/IPS, endpoint detection, VPN, and identity provider audit logs |
| Message queues and streaming | Kafka, RabbitMQ, and other broker operational logs |
| Domain | Coverage |
|---|---|
| Monitoring and APM | Prometheus/Alertmanager, Datadog, New Relic, and Dynatrace alert webhooks |
| Cloud native alerting | AWS CloudWatch Alarms, Azure Monitor Alerts, and GCP Alerting |
| Network and security events | SNMP traps, NetFlow anomalies, firewall/IDS/IPS, and VPN events |
| Synthetic and uptime checks | External probe and synthetic transaction check failures |
| ITSM and incident tools | ServiceNow, Jira Service Management, PagerDuty, and Opsgenie |
| Internal observability | Native ingestion of XpediOo AI Observability alerts, with full topology context |
| Capability | Primary question it answers |
|---|---|
| Log pattern mining | What are the handful of recurring patterns hiding inside millions of log lines? |
| Anomaly detection | Which log pattern just deviated from its historical baseline? |
| Event correlation and deduplication | Which of these alerts from five different monitoring tools describe the same underlying incident? |
| Alert storm suppression | How do we stop ten thousand alerts from one root cause from flooding every on call channel? |
| Root cause correlation | Which upstream event actually caused this cascade of symptoms? |
| Predictive failure scoring | How likely is this signature to escalate into an outage? |
| Auto remediation | Can this recurring failure be resolved automatically, within approved guardrails? |
| Natural language search | What happened, described in plain English instead of a query language? |
Infrastructure, cloud, container, application, network, and security logs, plus every alert fired by APM, network, synthetic, and ITSM tools, are ingested, normalized, and correlated in a single schema. No per tool silos, no per source noise reduction logic.
AIOps event correlation runs continuously in the background, collapsing alert storms from a dozen disconnected tools into a handful of deduplicated, topology aware incidents before a human ever sees them.
Auto remediation runs inside approval gates with full rollback history, so automated response earns operator trust instead of demanding it upfront.
Topology and dependency data from XpediOo AI Observability, along with its native alert ingestion, feed directly into event correlation, so root cause analysis reasons over the same map your infrastructure team already trusts.
Walk through how XpediOo AIOps & AI Log Management ingests, correlates, and automatically remediates incidents hiding inside your logs and event storms.